

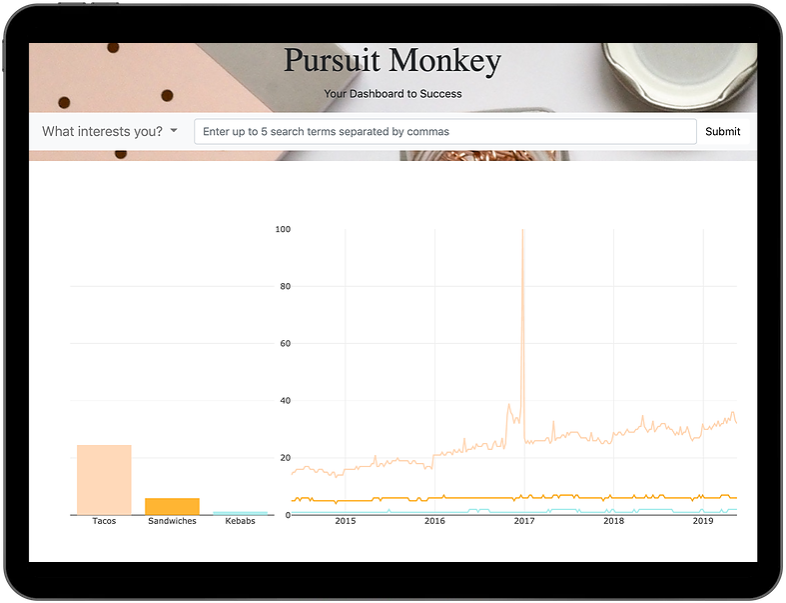
Pursuit Monkey
A simple web app built to quickly chart Google Trends data, Amazon data and Helium 10 data. Users enter up to five search terms to plot against one another and can navigate to different plots, including a Leaflet map. Technology used includes JavaScript, HTML, CSS, Python and SQL.
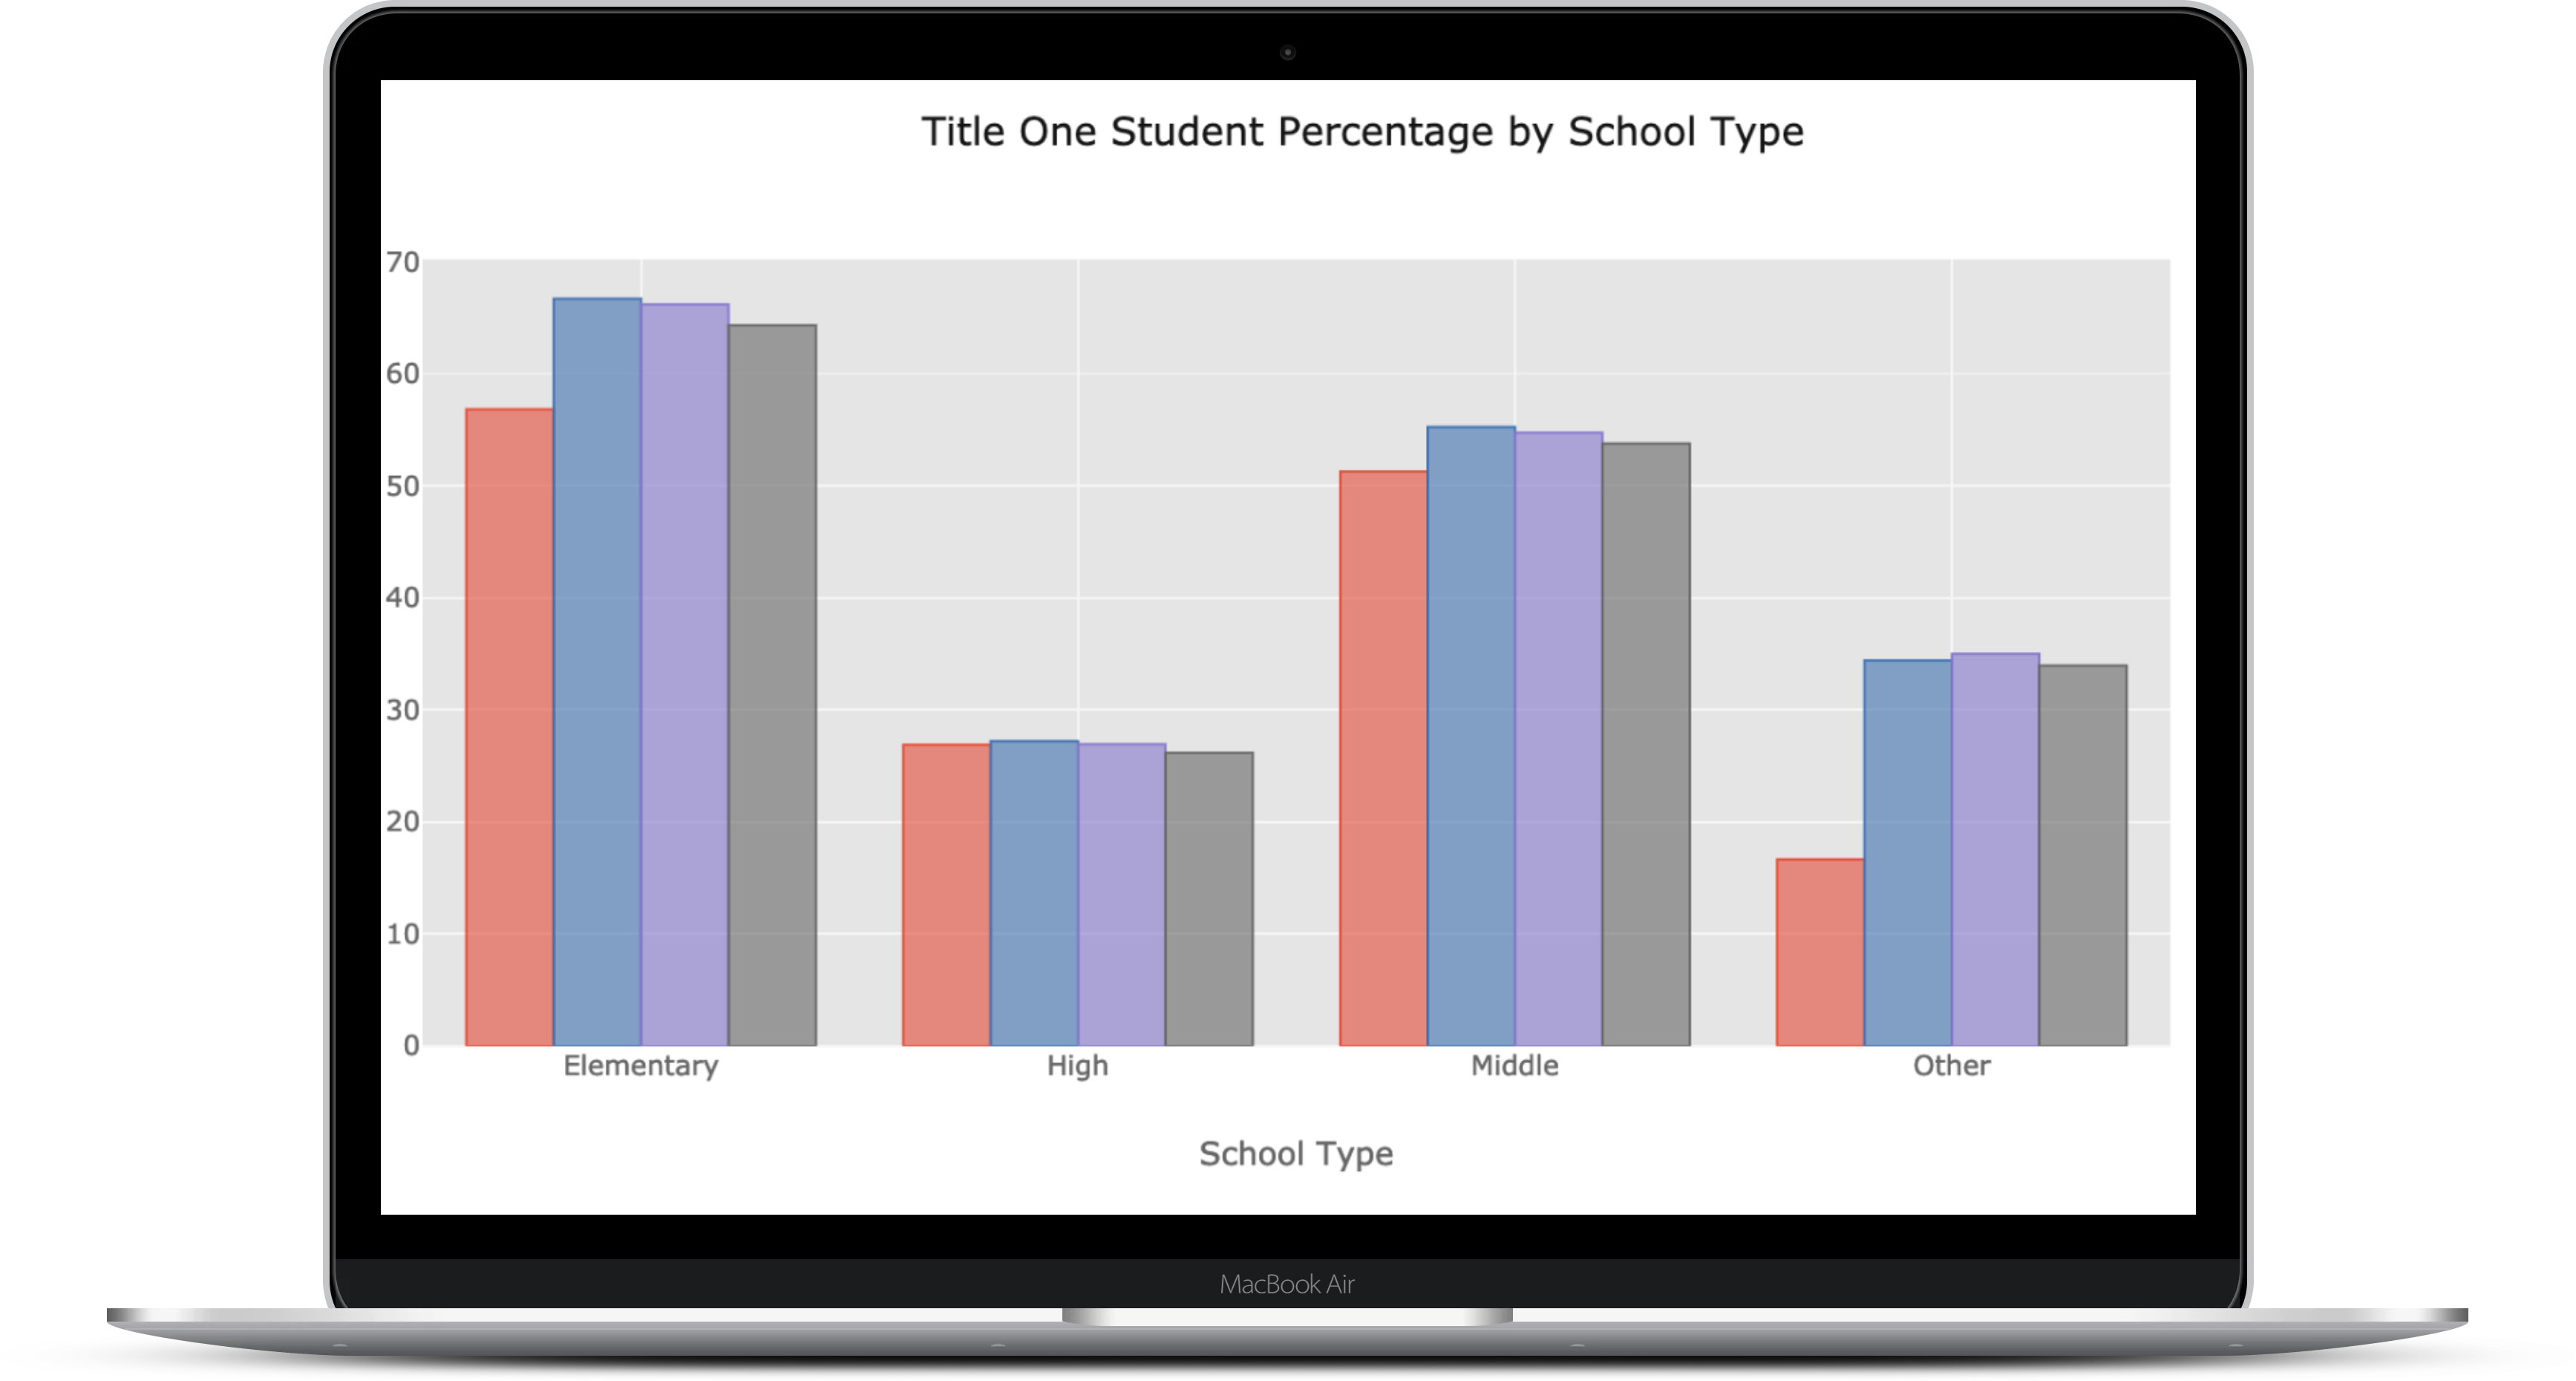
Title I Enrollment
Austin ISD enrollment has been shrinking year after year, local news has reported. Simultaneously, the number of Title I students in Austin has been on the rise. In this project we delve deeper into the problem by collecting, cleaning and displaying data with Python.
Technologies
Python
MySQL
MongoDB
Git
GitHub
JavaScript
HTML
CSS
Bootstrap
Heroku
Tools
Excel VBA
Tableau
SQLite
Microsoft Visual Studios